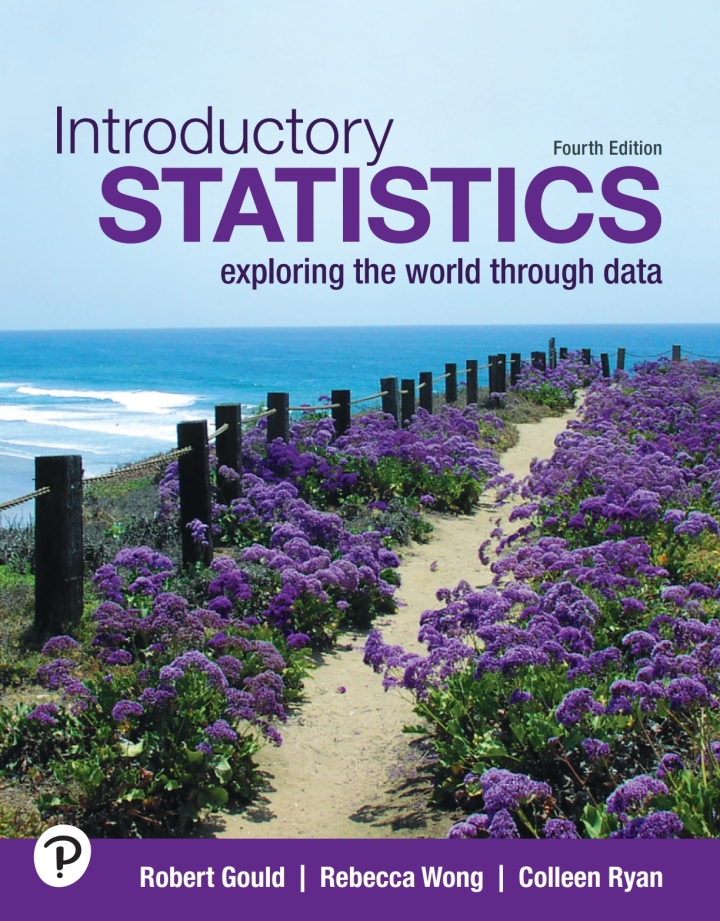
Introductory Statistics Exploring the World Through Data 4th edition by Gould Solution Manual
Original price was: $60.00.$30.00Current price is: $30.00.
Solution Manual for Introductory Statistics Exploring the World Through Data, 4th Edition, Robert N. Gould, Rebecca Wong, Colleen Ryan, ISBN-13: 9780138242145 To get more information about this please send us E-mail to smtb7000@gmail.com
Description
Solution Manual for Introductory Statistics Exploring the World Through Data 4/E Gould
Solution Manual for Introductory Statistics Exploring the World Through Data, 4th Edition, Robert N. Gould, Rebecca Wong, Colleen Ryan, ISBN-13: 9780138242145
Table of Contents
Index of Applications
1. Introduction to Data
Case Study: Dangerous Habit?
1.1 What Are Data?
1.2 Classifying and Storing Data
1.3 Investigating Data
1.4 Organizing Categorical Data
1.5 Collecting Data to Understand Causality
Data Project: Introduction: Importing Data
2. Picturing Variation with Graphs
Case Study: Student-to-Teacher Ratio at Colleges
2.1 Visualizing Variation in Numerical Data
2.2 Summarizing Important Features of a Numerical Distribution
2.3 Visualizing Variation in Categorical Variables
2.4 Summarizing Categorical Distributions
2.5 Interpreting Graphs
Data Project: The Bare Bones: Data Types
3. Numerical Summaries of Center and Variation
Case Study: Living in a Risky World
3.1 Summaries for Symmetric Distributions
3.2 What’s Unusual? The Empirical Rule and z-Scores
3.3 Summaries for Skewed Distributions
3.4 Comparing Measures of Center
3.5 Using Boxplots for Displaying Summaries
Data Project: The W’s and One H: Asking Interrogative Questions
4. Regression Analysis: Exploring Associations between Variables
Case Study: Forecasting Home Prices
4.1 Visualizing Variability with a Scatterplot
4.2 Measuring Strength of Association with Correlation
4.3 Modeling Linear Trends
4.4 Evaluating the Linear Model
Data Project: Get It Sorted: Sorting Data
5. Modeling Variation with Probability
Case Study: SIDS or Murder?
5.1 What Is Randomness?
5.2 Finding Theoretical Probabilities
5.3 Associations in Categorical Variables
5.4 Finding Empirical Probabilities
Data Project: Ask Good Questions: Posing Statistical Investigative Questions
6. Modeling Random Events: The Normal and Binomial Models
Case Study: You Sometimes Get More Than You Pay for
6.1 Probability Distributions Are Models of Random Experiments
6.2 The Normal Model
6.3 The Binomial Model (Optional)
Data Project: Transformations for a Better Analysis
7. Survey Sampling and Inference
Case Study: Spring Break Fever: Just What the Doctors Ordered?
7.1 Learning about the World through Surveys
7.2 Measuring the Quality of a Survey
7.3 The Central Limit Theorem for Sample Proportions
7.4 Estimating the Population Proportion with Confidence Intervals
7.5 Comparing Two Population Proportions with Confidence
Data Project: Make it Smaller: Subsetting Data
8. Hypothesis Testing for Population Proportions
Case Study: Dodging the Question
8.1 The Essential Ingredients of Hypothesis Testing
8.2 Hypothesis Testing in Four Steps
8.3 Hypothesis Tests in Detail
8.4 Comparing Proportions from Two Populations
Data Project: On and Off, and Off and On: Working with Binary Variables
9. Inferring Population Means
Case Study: You Look Sick! Are You Sick?
9.1 Sample Means of Random Samples
9.2 The Central Limit Theorem for Sample Means
9.3 Answering Questions about the Mean of a Population
9.4 Hypothesis Testing for Means
9.5 Comparing Two Population Means
9.6 Overview of Analyzing Means
Data Project: Non-binary Coding: Creating Multi-valued Categorical Variables
10. Associations between Categorical Variables
Case Study: Popping Better Popcorn
10.1 The Basic Ingredients for Testing with Categorical Variables
10.2 The Chi-Square Test for Goodness of Fit
10.3 Chi-Square Tests for Associations between Categorical Variables
10.4 Hypothesis Tests When Sample Sizes Are Small
Data Project: Dating Yourself: Creating New Variables from Dates
11. Multiple Comparisons and Analysis of Variance
Case Study: Seeing Red
11.1 Multiple Comparisons
11.2 The Analysis of Variance
11.3 The ANOVA Test
11.4 Post-Hoc Procedures
Data Project: What’s in a Name: Splitting and Merging Columns
12. Experimental Design: Controlling Variation
Case Study: Does Stretching Improve Athletic Performance?
12.1 Variation Out of Control
12.2 Controlling Variation in Surveys
12.3 Reading Research Papers
Data Project: Making Stacks: Stacking and Unstacking Data
13. Inference without Normality
Case Study: Contagious Yawns
13.1 Transforming Data
13.2 The Sign Test for Paired Data
13.3 Mann-Whitney Test for Two Independent Groups
13.4 Randomization Tests
Data Project: Breathe Deeply: Prepare a Data Set for Analysis
14. Inference for Regression
Case Study: Another Reason to Stand at Your Desk?
14.1 The Linear Regression Model
14.2 Using the Linear Model
14.3 Predicting Values and Estimating Means
Data Project: Is the Pen Mightier than the Keyboard?
Appendices
A: Tables
B: Answers to Odd-Numbered Exercises
C: Credits
Index


